New paper out
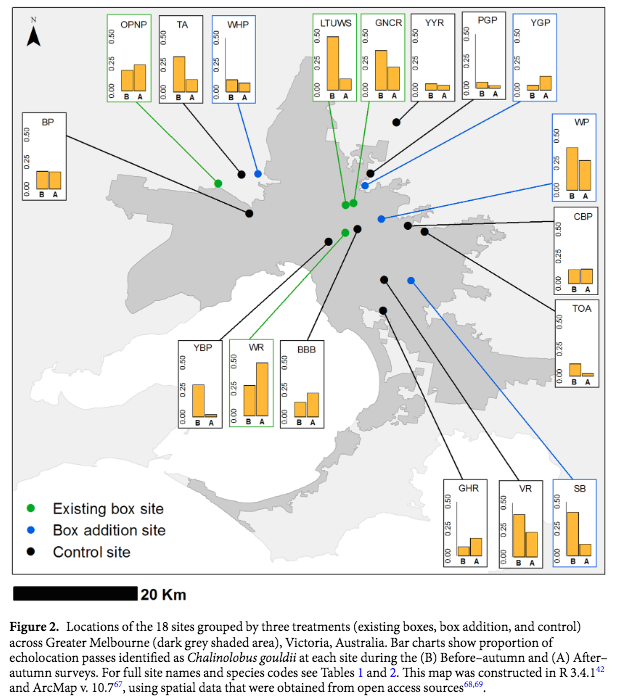
Congratulations to Nick Gale (Honours 2023) on publication of his honours research in Pacific Conservation Biology https://doi.org/10.1071/PC24001

New paper out
Congratulations to Nick Gale (Honours 2023) on publication of his honours research in Pacific Conservation Biology https://doi.org/10.1071/PC24001
New paper out
Congratulations to Melissa Walker (Honours 2016) on publication of her honours research
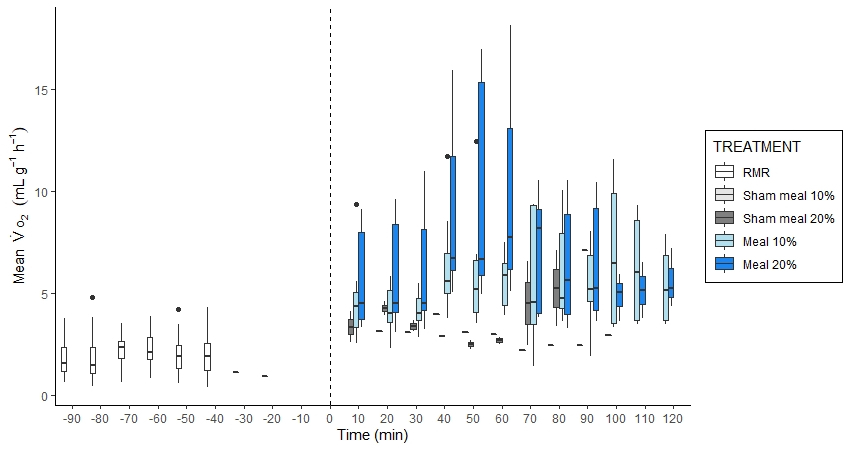
Fig. 1. Mean metabolic rates (VO2 mL g–1 h–1) for Chalinolobus gouldii (n = 58), for RMR (before the vertical dashed line) and PMR at measured time periods (after the vertical dashed line). Data are grouped across all individuals within each treatment: sham-fed bats, bats fed a 10% or a 20% meal size. Meals were provided at time ‘0’ as indicated by the vertical dashed line. For each boxplot, the box indicates the range between the first and third quartiles of the data, the whiskers extend up to 1.5 times the interquartile range, and outliers occur as points beyond those limits.
New paper out
Congratulations to Steve Griffiths on publication of his final chapter of his PhD